 Purr
Jaeger tracing
Connect Jaeger, propagate trace context, and follow an HTTP request into its service spans without leaving Purr.
Send a request, inspect its response, then follow the same execution into Jaeger. Purr keeps the trace beside the request so you can investigate which services ran and where the time went.
Example setup
The screenshots use a local NestJS microservices application, a Tracing workspace, and a saved Tracing_demo request. This is one example of an instrumented API; the same settings apply to your own services.
| Component | Configuration shown |
|---|---|
| API gateway | http://localhost:3000 |
| Request | GET {{base_url}}/case/{{case_id}} |
| Jaeger query endpoint | http://localhost:16687 |
| Propagation | W3C Trace Context |
| Authentication | Bearer authentication for the API; no authentication for local Jaeger |
base_url and case_id are workspace variables. Use your API’s URL, authentication, and variables when configuring your own request.
Purr needs an instrumented backend that records and exports spans. Enabling tracing in the client sends context and enables lookup; it does not instrument your services for you.
Add a Jaeger integration
There are two entry points:
- From the workspace: click the workspace name in the top bar → Workspace settings → Integrations → Add integration.
- From a request: open Settings, find Tracing, and choose Add provider when no tracing provider is configured. This opens integration setup for the current workspace.
Choose Jaeger in the provider picker. Jaeger is the currently available tracing provider.
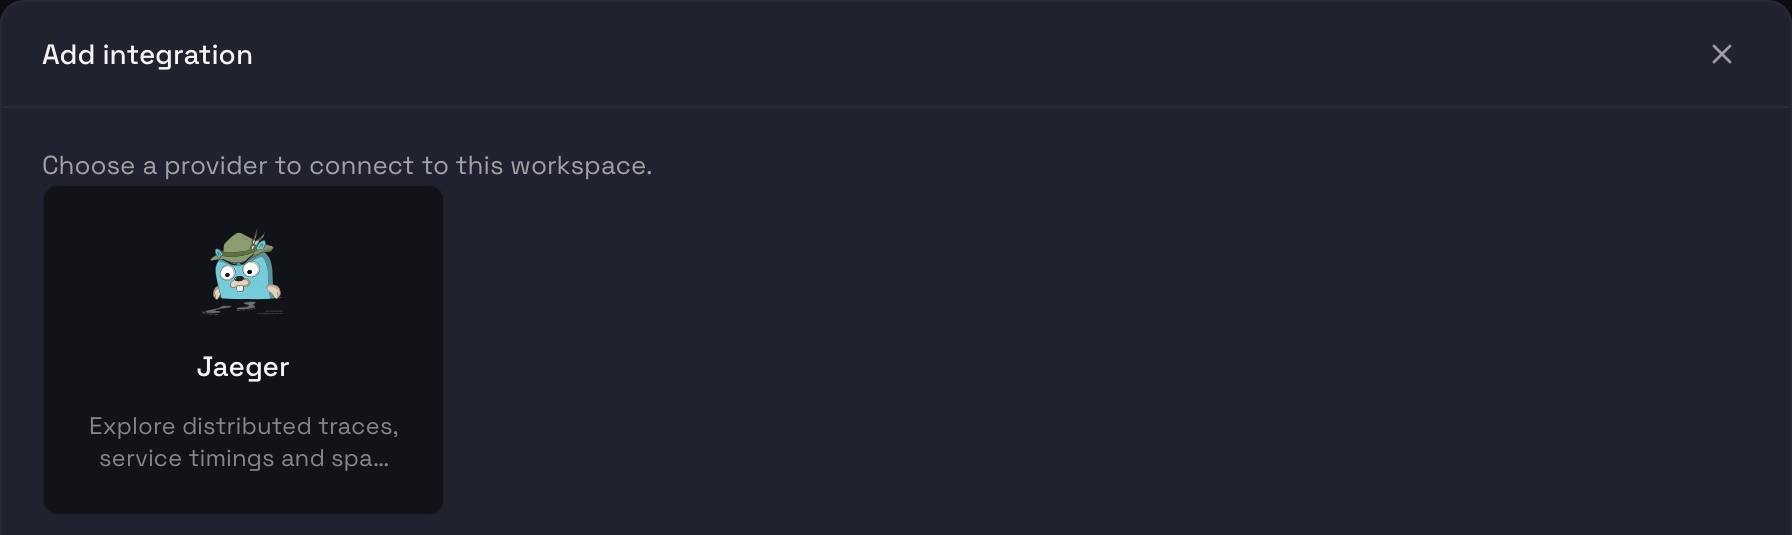
Connection and authentication
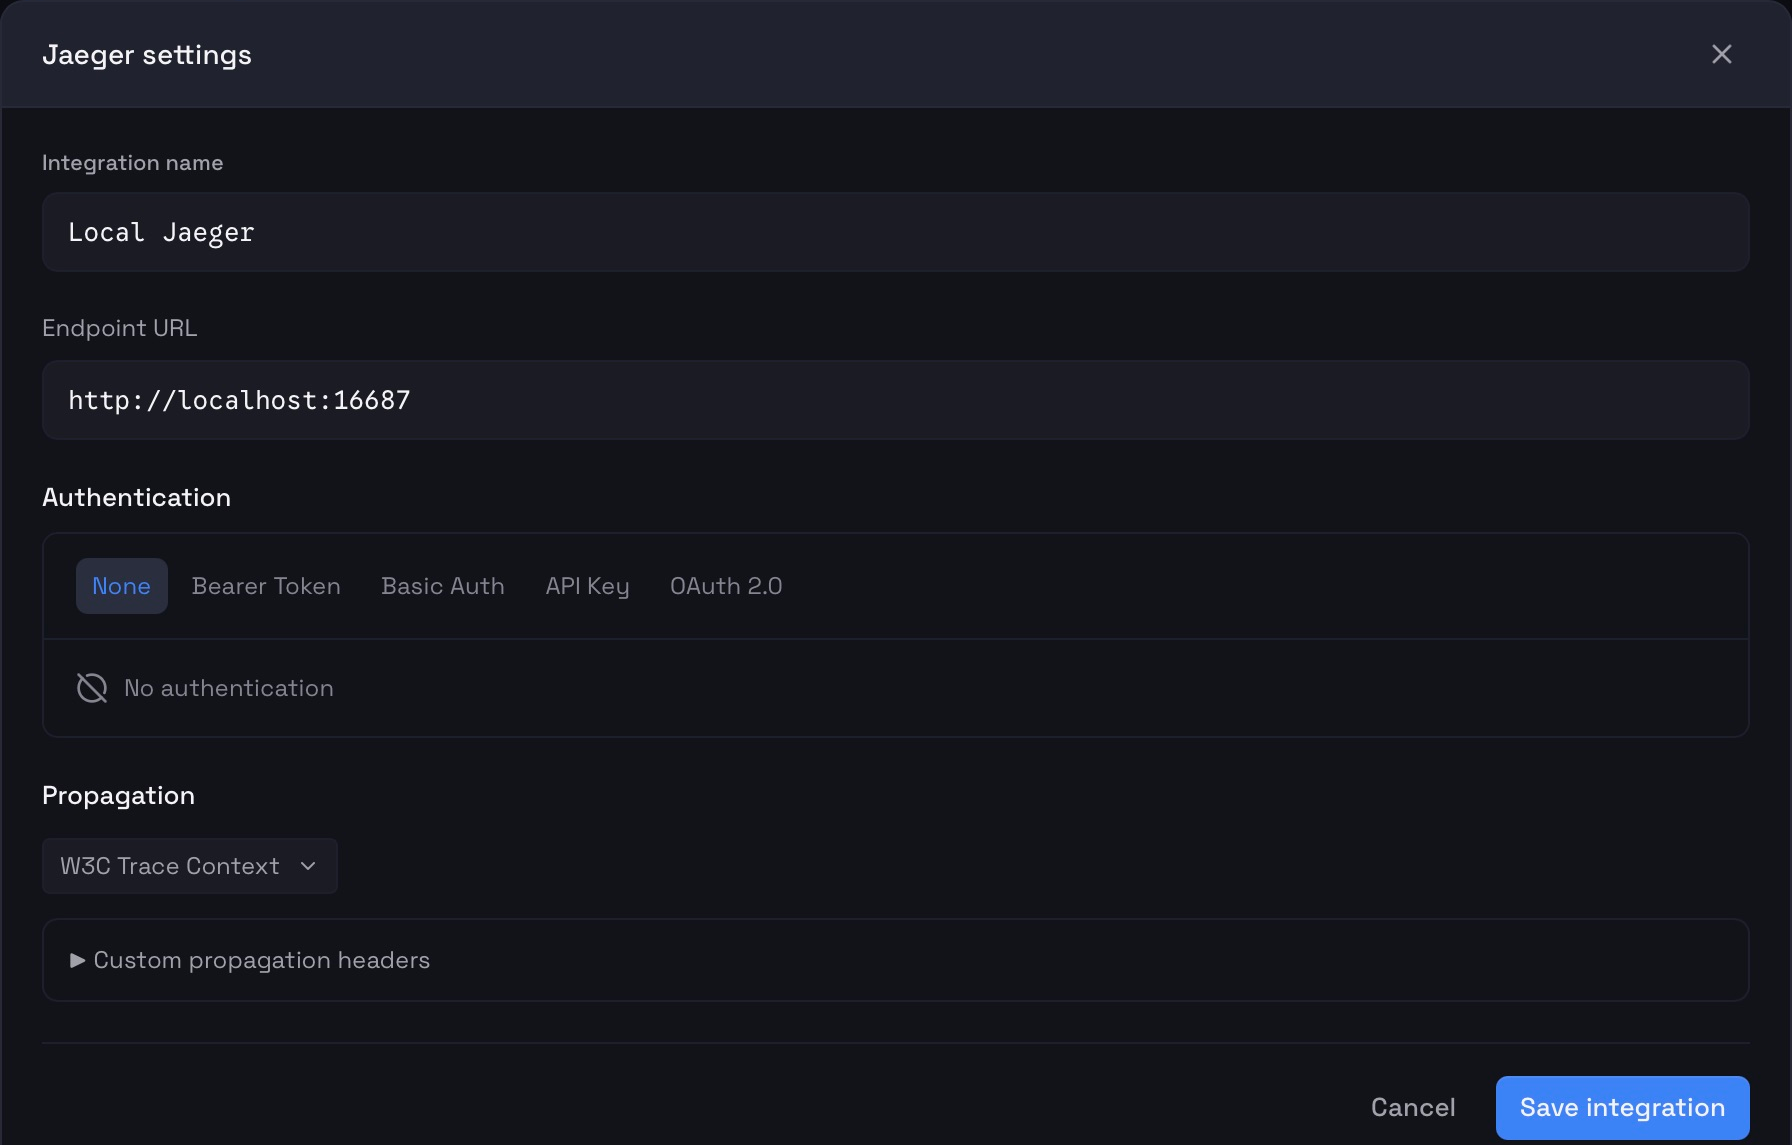
The integration settings describe how Purr connects to your Jaeger instance:
| Setting | Value | Purpose |
|---|---|---|
| Integration name | Local Jaeger |
A recognizable label inside Purr. |
| Endpoint URL | http://localhost:16687 |
The query-service URL; use the address of your deployment. |
| Authentication | None | Use None only when the endpoint does not require authentication. |
| Propagation | W3C Trace Context | The context format accepted by your application. |
The endpoint is Jaeger’s query service, not an OTLP collector or /v1/traces ingestion URL. If your deployment uses a different host, port, or base path, use that query-service address instead.
Integration authentication is separate from the bearer token used by your API request. If your Jaeger deployment is protected, choose the method it requires: Bearer Token, Basic Auth, API Key, or OAuth 2.0, and fill in the corresponding settings. The local setup shown here uses None.
Choose a propagation context
Propagation carries a trace identity with the outgoing request so the backend can continue that trace across service boundaries.
| Choice | Behavior |
|---|---|
| W3C Trace Context | Generates a traceparent header for the outgoing execution. Use it when the backend extracts W3C context. |
| B3 | Generates a single b3 header. Choose it when your backend is configured to extract B3 context. |
| Off | Does not generate propagation headers. Lookup can still use a trace identity available in the exchange or one you enter manually. |
Choose the format supported by the application’s tracing instrumentation, not just by the storage provider. Sending B3 to a service that only extracts W3C context will not make that service continue the supplied trace.
Custom propagation headers
Expand Custom propagation headers in the integration settings. Leave both lists empty when your application uses standard propagation headers.
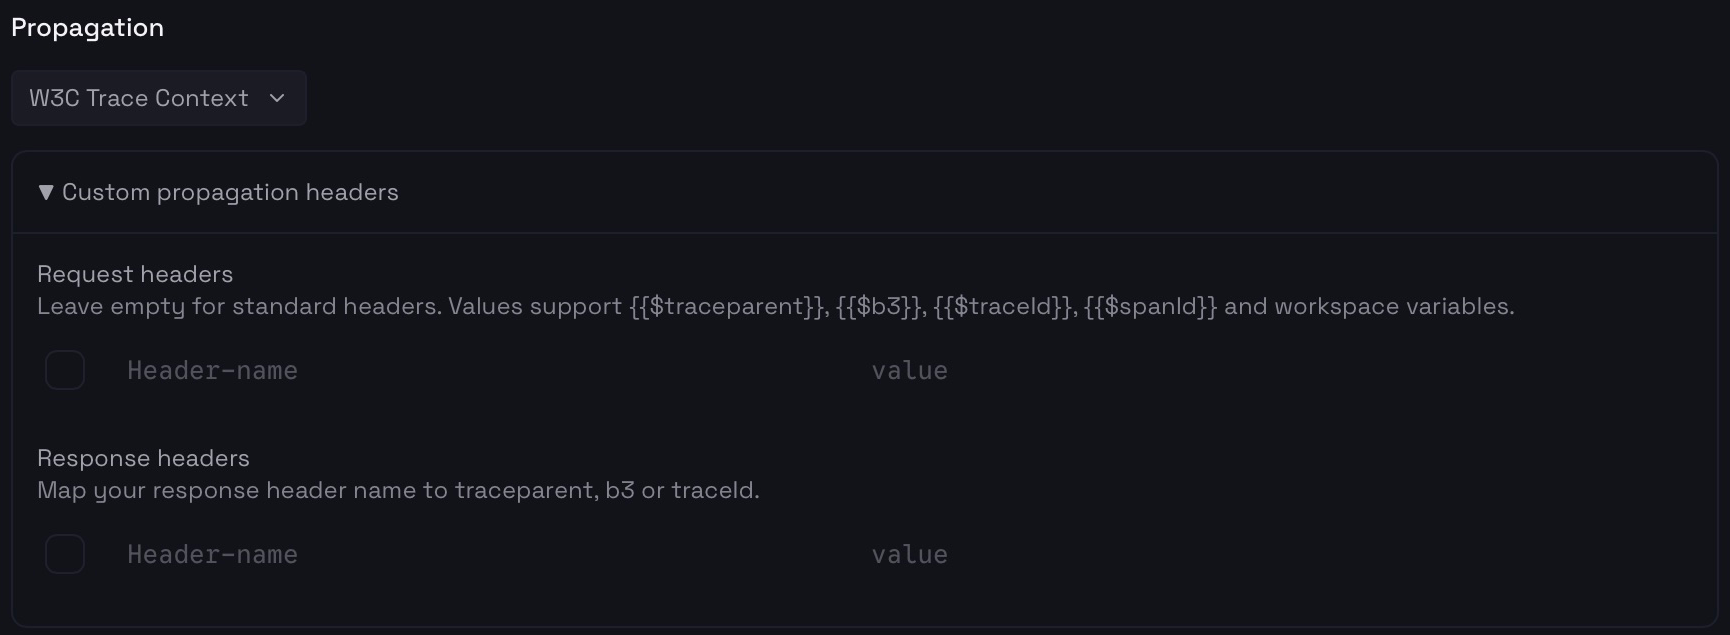
Request headers are useful when a gateway or application expects context under a custom name. Values support workspace variables and these generated placeholders:
| Placeholder | Generated value |
|---|---|
{{$traceparent}} |
A complete W3C traceparent value. |
{{$b3}} |
A complete single-header B3 value. |
{{$traceId}} |
The trace ID for this execution. |
{{$spanId}} |
The generated span ID. |
For example, a backend explicitly configured to read x-trace-context could use x-trace-context → {{$traceparent}}. This is an example mapping, not a header to add to every request. Custom request templates replace the default generated header set: include traceparent → {{$traceparent}} too if your backend still needs the standard header. Use W3C or B3 propagation to generate these values.
Response headers are mappings, not outgoing headers. Enter the header your server returns and the format of its value:
| Returned header — example | Mapping value | Expected response value |
|---|---|---|
x-trace-id |
traceId |
A raw trace ID. |
x-trace-context |
traceparent |
A complete W3C traceparent value. |
x-b3-context |
b3 |
A complete single-header B3 value. |
These mappings help when the server creates its own trace and returns it under a nonstandard header. They do not make the server emit that header. A request ID such as x-request-id is not automatically a Jaeger trace ID; map it only if your backend actually returns a valid trace identity there.
Click Save integration. Check that Local Jaeger is enabled in the workspace’s Integrations list. You can return here to edit its endpoint, authentication, or propagation settings.
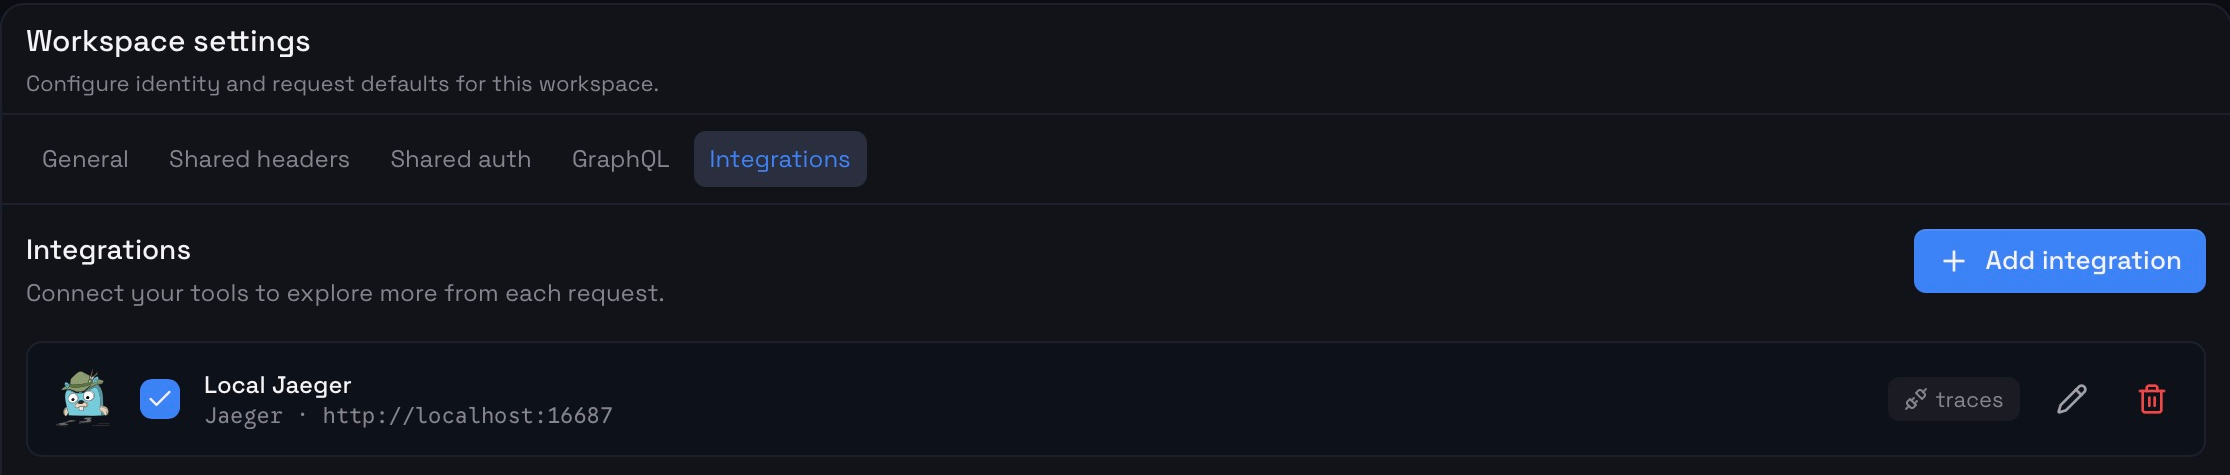
Enable tracing on the request
Open the request’s Settings tab. Confirm Local Jaeger under Tracing provider, then turn on Enable tracing. If several integrations are available, select the one intended for this request.
The request shown in the screenshots uses:
{{base_url}}/case/{{case_id}}Keep the URL and authentication appropriate for your API. Tracing does not require adding a special path to the endpoint.
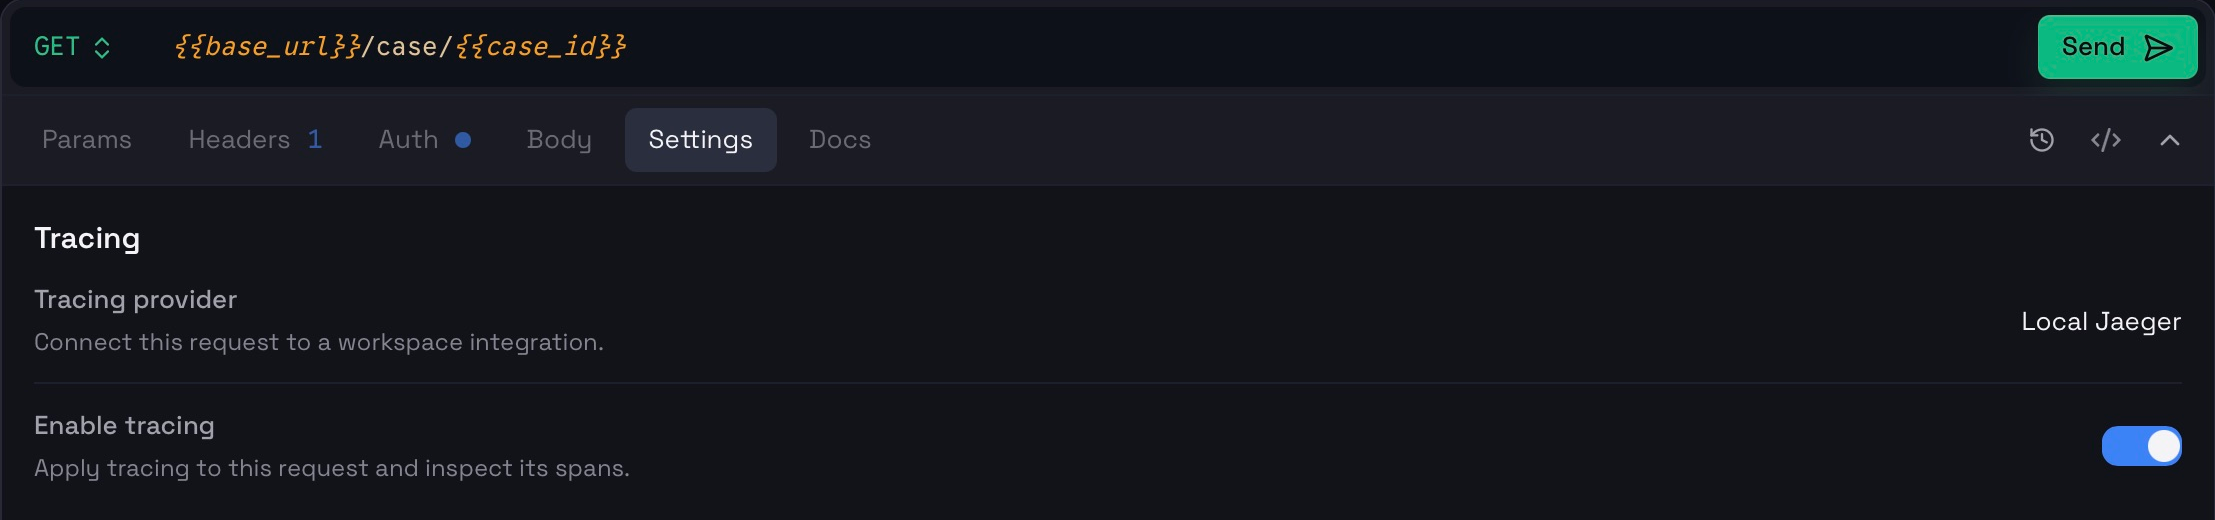
Open Headers. With W3C propagation, Purr shows a managed row:
traceparent: {{$traceparent}}
You do not need to create a workspace variable named $traceparent or paste a fixed ID. Purr resolves the placeholder for the execution. B3 propagation similarly shows b3: {{$b3}}; custom templates use the names you configured.
Explicit tracing headers are preserved. If you already added a standard tracing header yourself, Purr does not replace it with a newly generated context. Remove that explicit header if you want Purr to generate a fresh context instead.
Send the request and load its trace
Click Send to execute the request. The example below returns 200 OK.
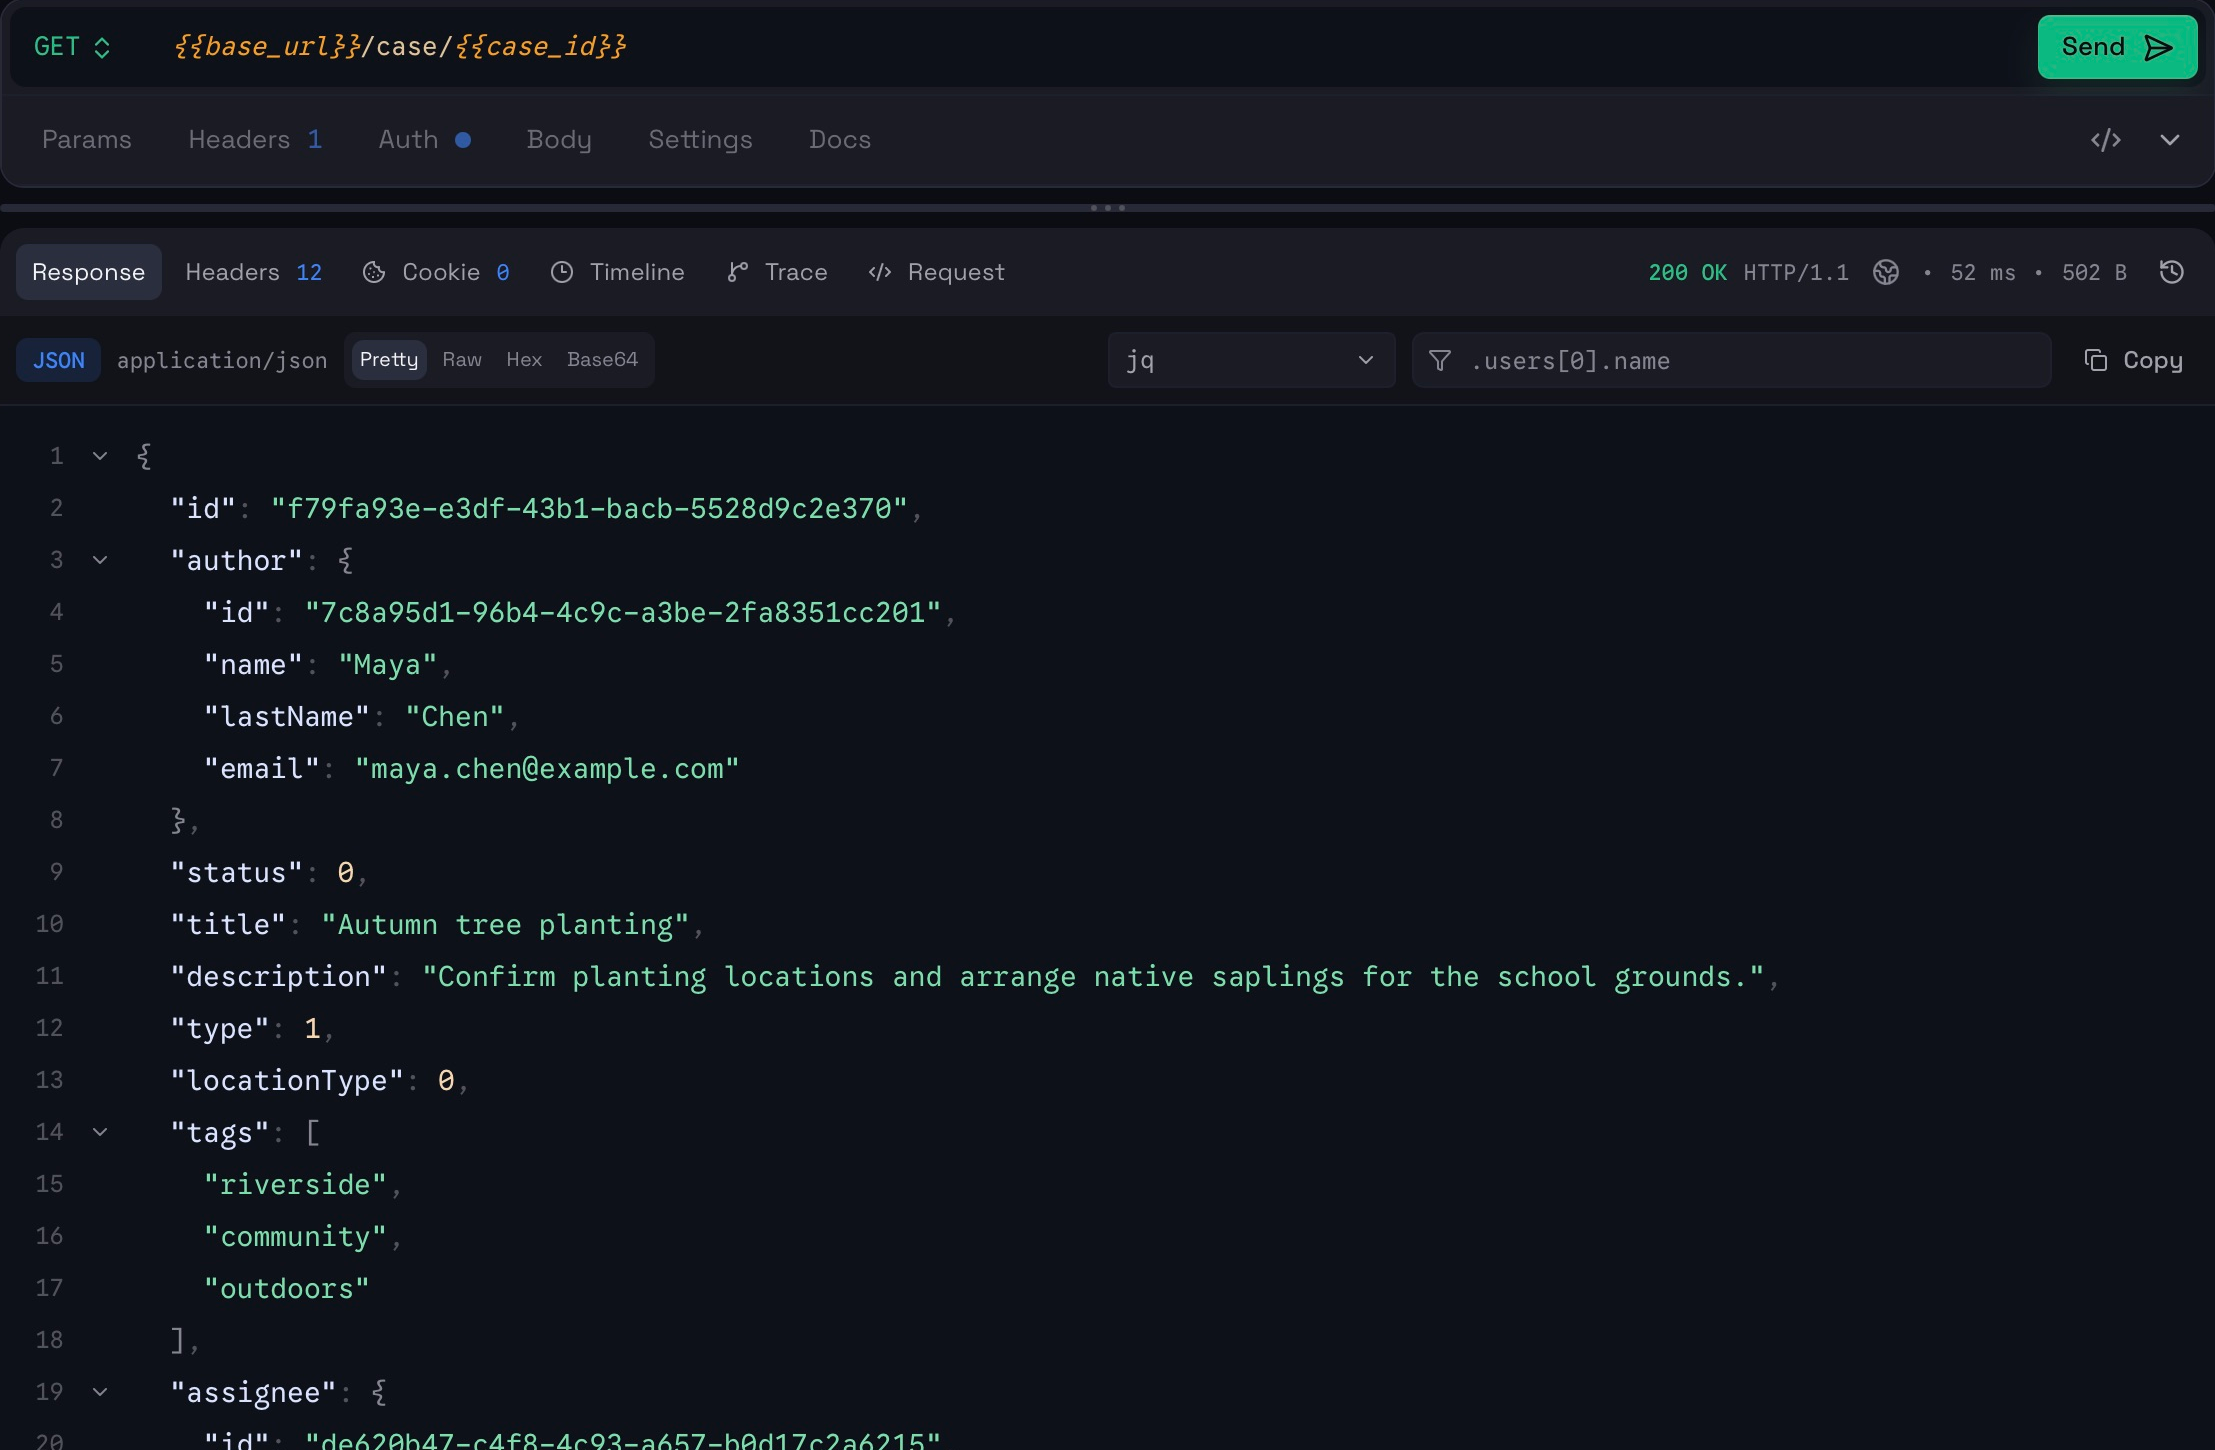
Open Trace in the response tabs. This is the tracing view; it becomes available for a tracing-enabled execution. The separate Timeline tab describes the HTTP request’s network phases, not the distributed spans.
The first lookup may be empty. Instrumentation can export spans in batches, and Jaeger may not have the trace available immediately after the response arrives.

Wait briefly and click Load trace again. Leave Trace ID (optional) empty to use the current execution’s correlation. You do not need to resend the HTTP request just to retry lookup.
The illustrated execution contains 36 spans across 3 services. The number of spans and their timings depend on the work performed by the backend, including cache hits and downstream calls.
Read the tracing window
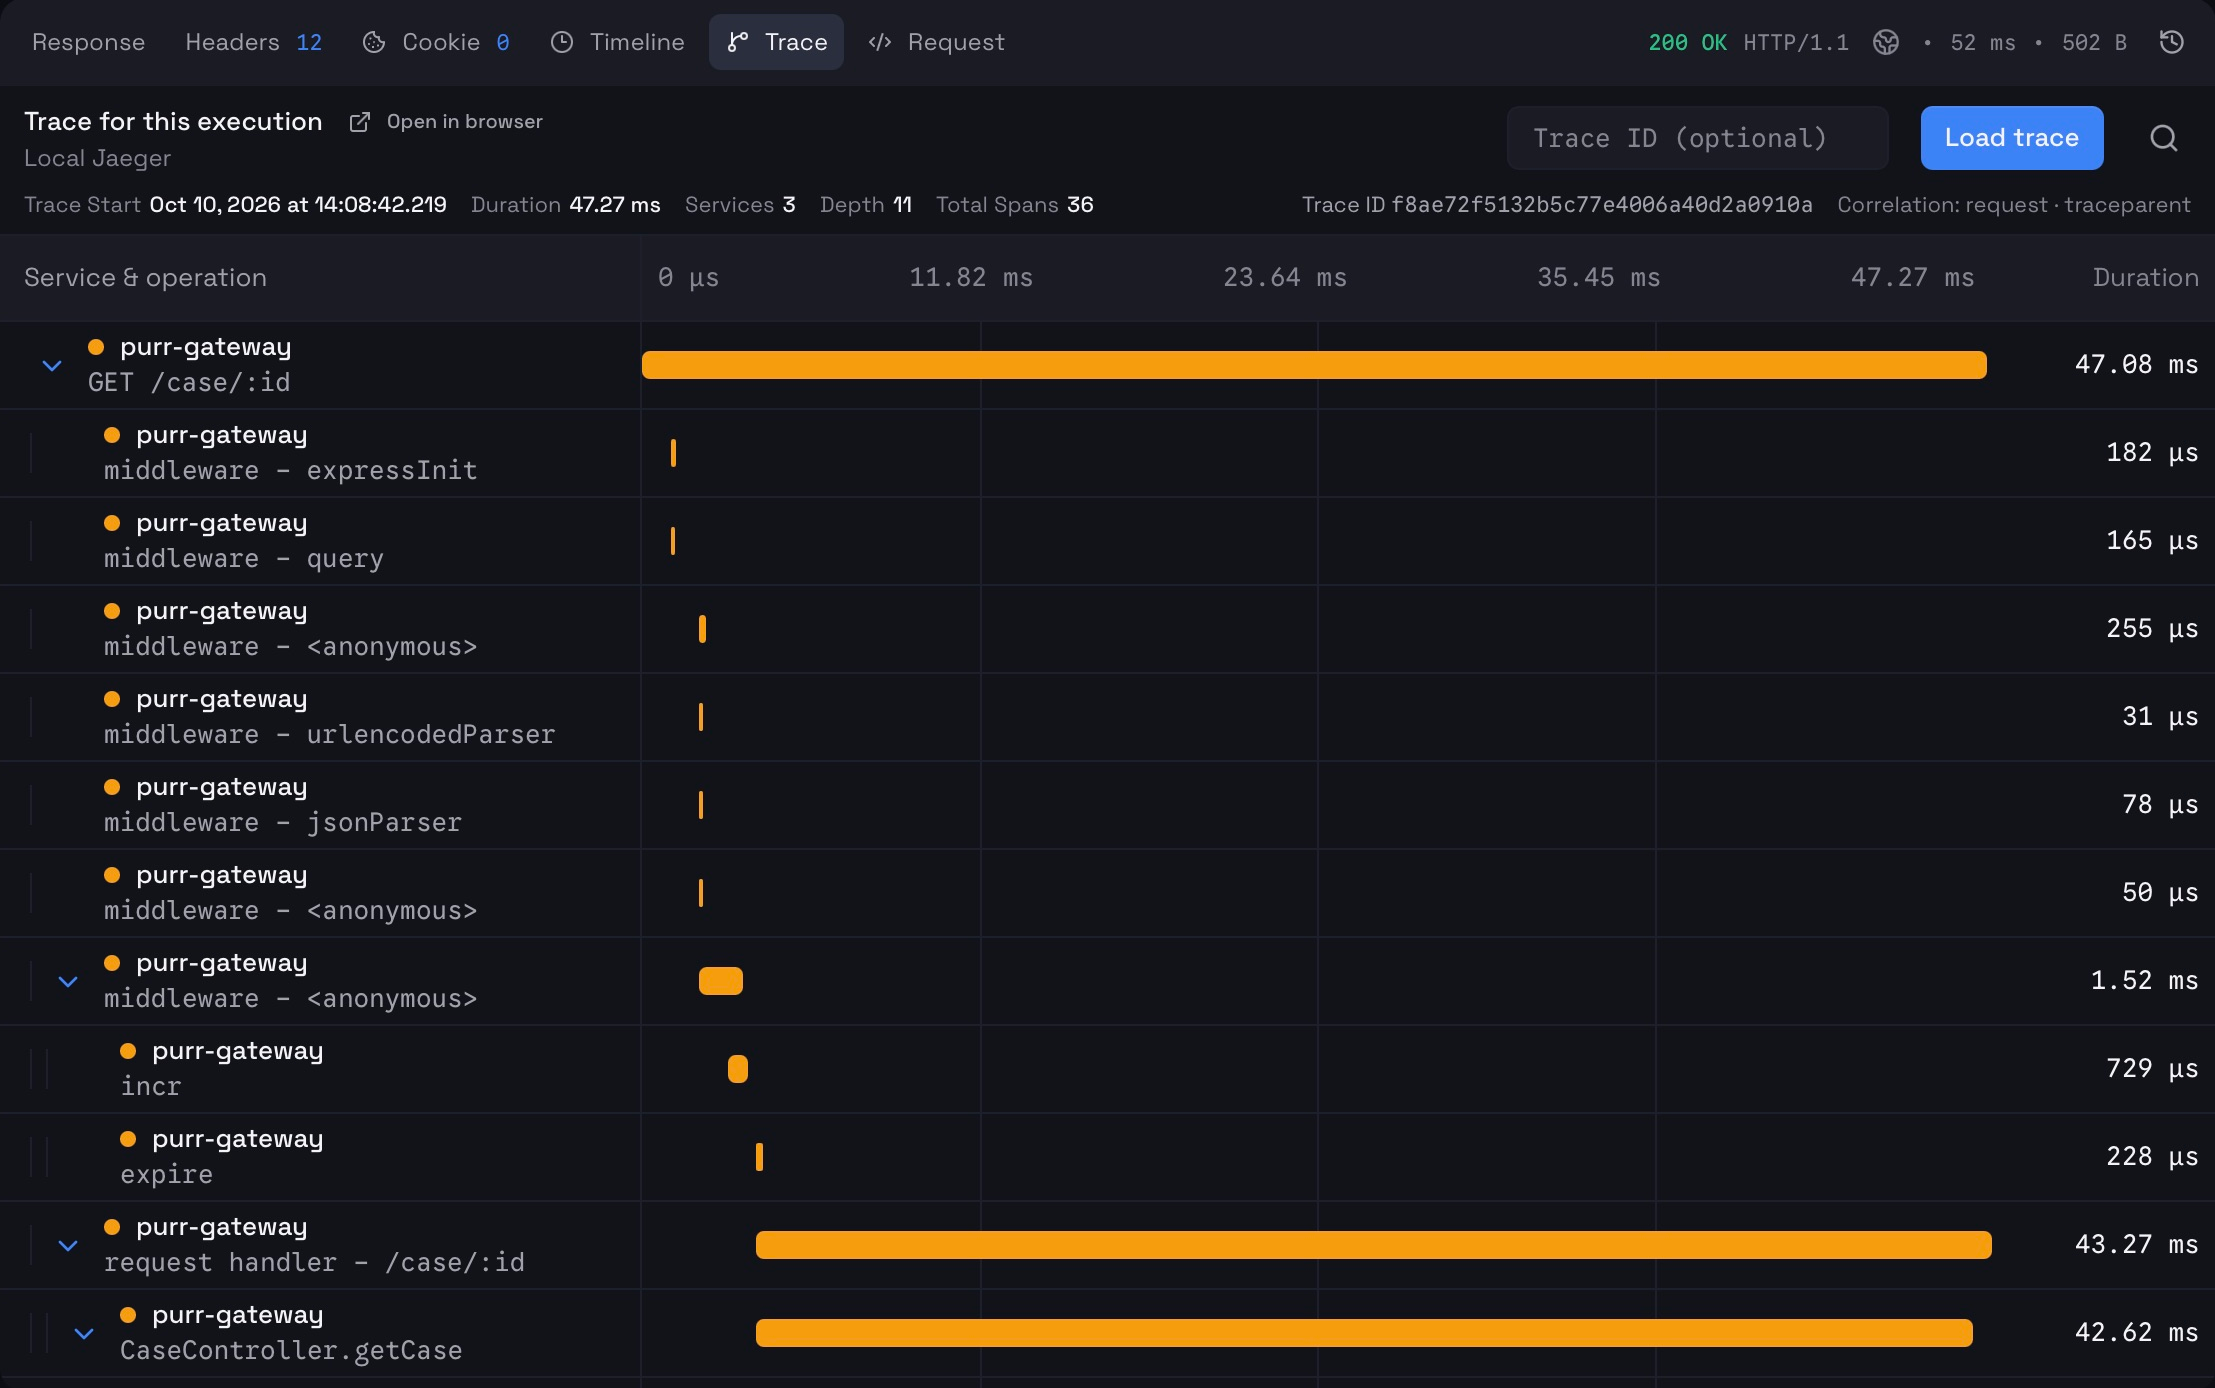
The top of the panel contains:
- Trace for this execution and the selected integration name.
- Trace ID (optional) and Load trace for an explicit lookup or a retry.
- Find in trace to search within the loaded trace.
- Trace Start, Duration, Services, Depth, and Total Spans to summarize when the trace began, its elapsed time, service count, nesting depth, and span count.
- The trace identity and Correlation information explaining how the lookup was associated with this execution.
The waterfall shows service and operation names on the left and timing bars on a shared time axis. Expand or collapse parent spans to follow calls through the service tree. A bar’s position shows when the span started; its length and duration show how long it lasted. Nested and parallel work can overlap, so adding every span’s duration does not give the total request time.
Inspect a span
Select a span to open its details beside the waterfall.
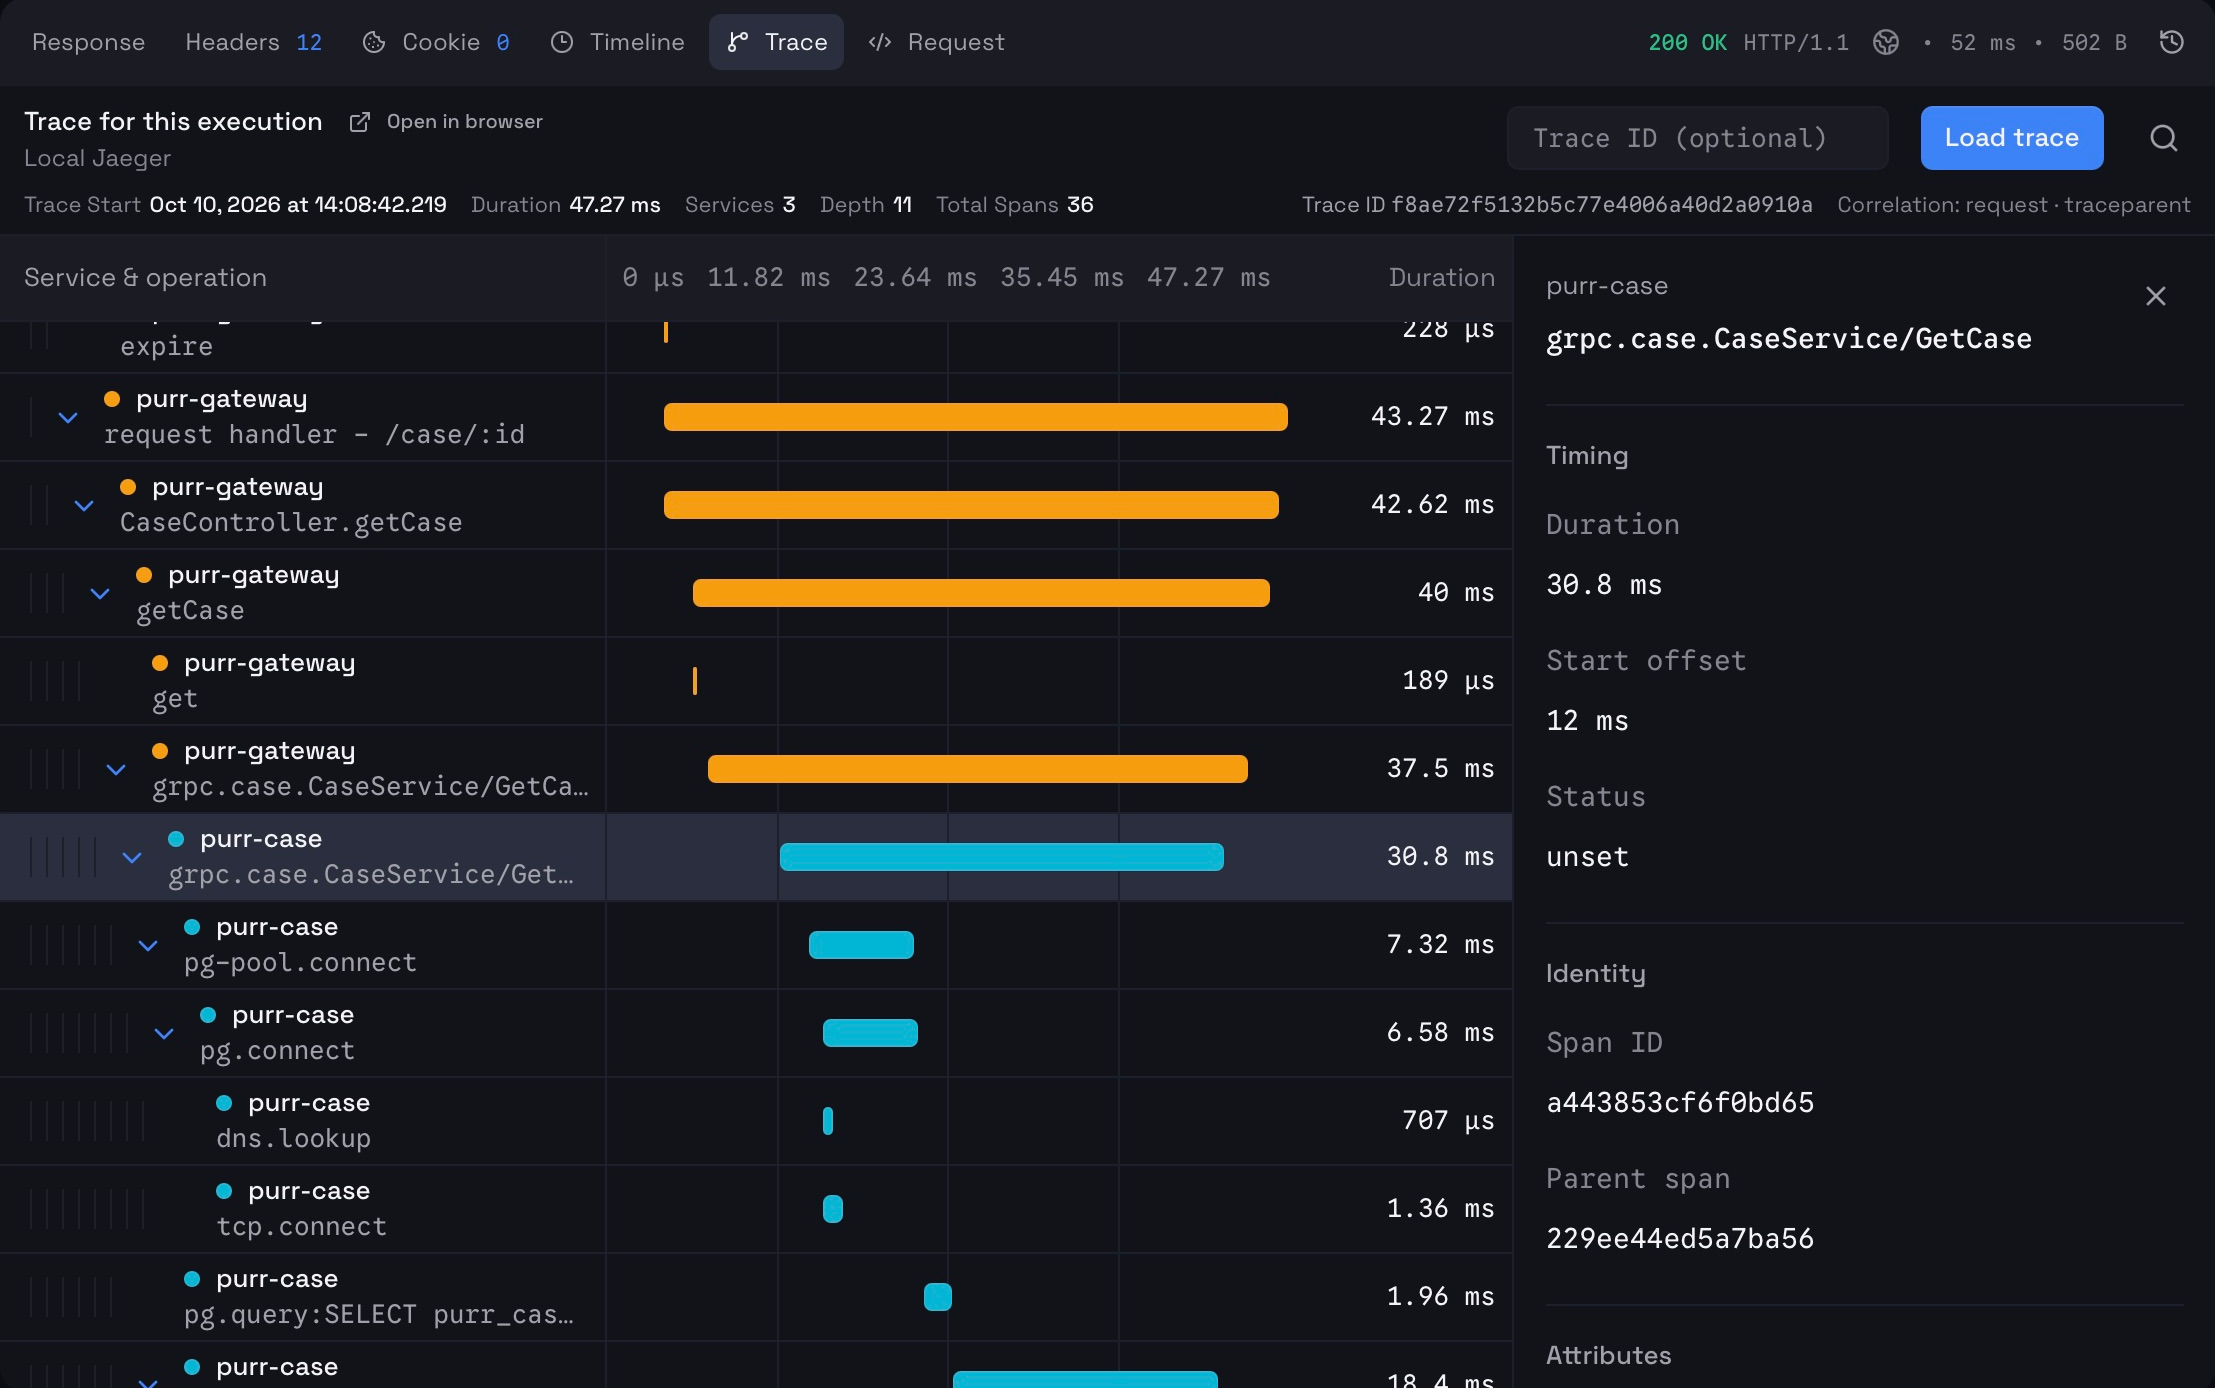
The details include service and operation, Duration, Start offset, Status, Span ID, Parent span, and Attributes reported by the instrumentation. Scroll the details panel to inspect the attributes available for that span, such as an RPC method, database statement, or error message.
In the screenshot, purr-case handles grpc.case.CaseService/GetCase. Its details show a duration of 30.8 ms, a 12 ms start offset, and the span and parent IDs. A status of unset means no explicit status was recorded for that span; interpret it alongside the response and attributes. The available attributes depend on the backend instrumentation.
Open in browser
Open in browser opens the currently loaded trace in the configured Jaeger web UI. It uses the integration’s endpoint and the resolved trace ID, leading to that trace’s /trace/<trace-id> page. It does not resend the API request. If Jaeger’s browser UI is protected, the browser may require its own sign-in.
Look up a trace by ID
If you have a trace ID from application logs or another debugging session, paste it into Trace ID (optional) and click Load trace or press Enter.
Use a nonzero 16- or 32-character hexadecimal trace ID. Paste the ID itself, not a full traceparent value, a Jaeger URL, or an arbitrary request ID.

This looks up that trace in the selected provider; it does not change the request’s propagation header or send the request again. Clear the field and click Load trace to return to lookup from the current execution.
Correlation is in beta
Propagation sends context to your API. Correlation connects the resulting request/response exchange to a trace in the provider. The correlation workflow is currently in beta.
Purr uses supported context in response and request headers, including configured custom mappings, to find candidate trace identities. Response context is considered before request context. In the example, Correlation: request · traceparent means the lookup came from the outgoing W3C header. A manual ID is labeled manual · trace-id.
When the identities differ, the panel can distinguish Sent, Lookup, and Resolved IDs. Review these when a gateway rewrites context or a service starts a new trace. Automatic correlation depends on what your backend propagates, returns, samples, and exports; enabling the client alone cannot guarantee a matching stored trace.
If a trace remains unavailable:
- Retry Load trace after giving export and ingestion time to complete.
- Confirm the integration points to the correct Jaeger query endpoint and its authentication is valid.
- Check that the backend extracts the selected propagation format and exports sampled spans to that Jaeger instance.
- Check custom header names and response mapping formats, if configured.
- Try a known trace ID to distinguish a provider connection problem from a correlation problem.
Continue with HTTP requests for request configuration or responses for response inspection.