 Purr
HTTP CLIENT / JAEGER TRACING
Follow the request
past the response.
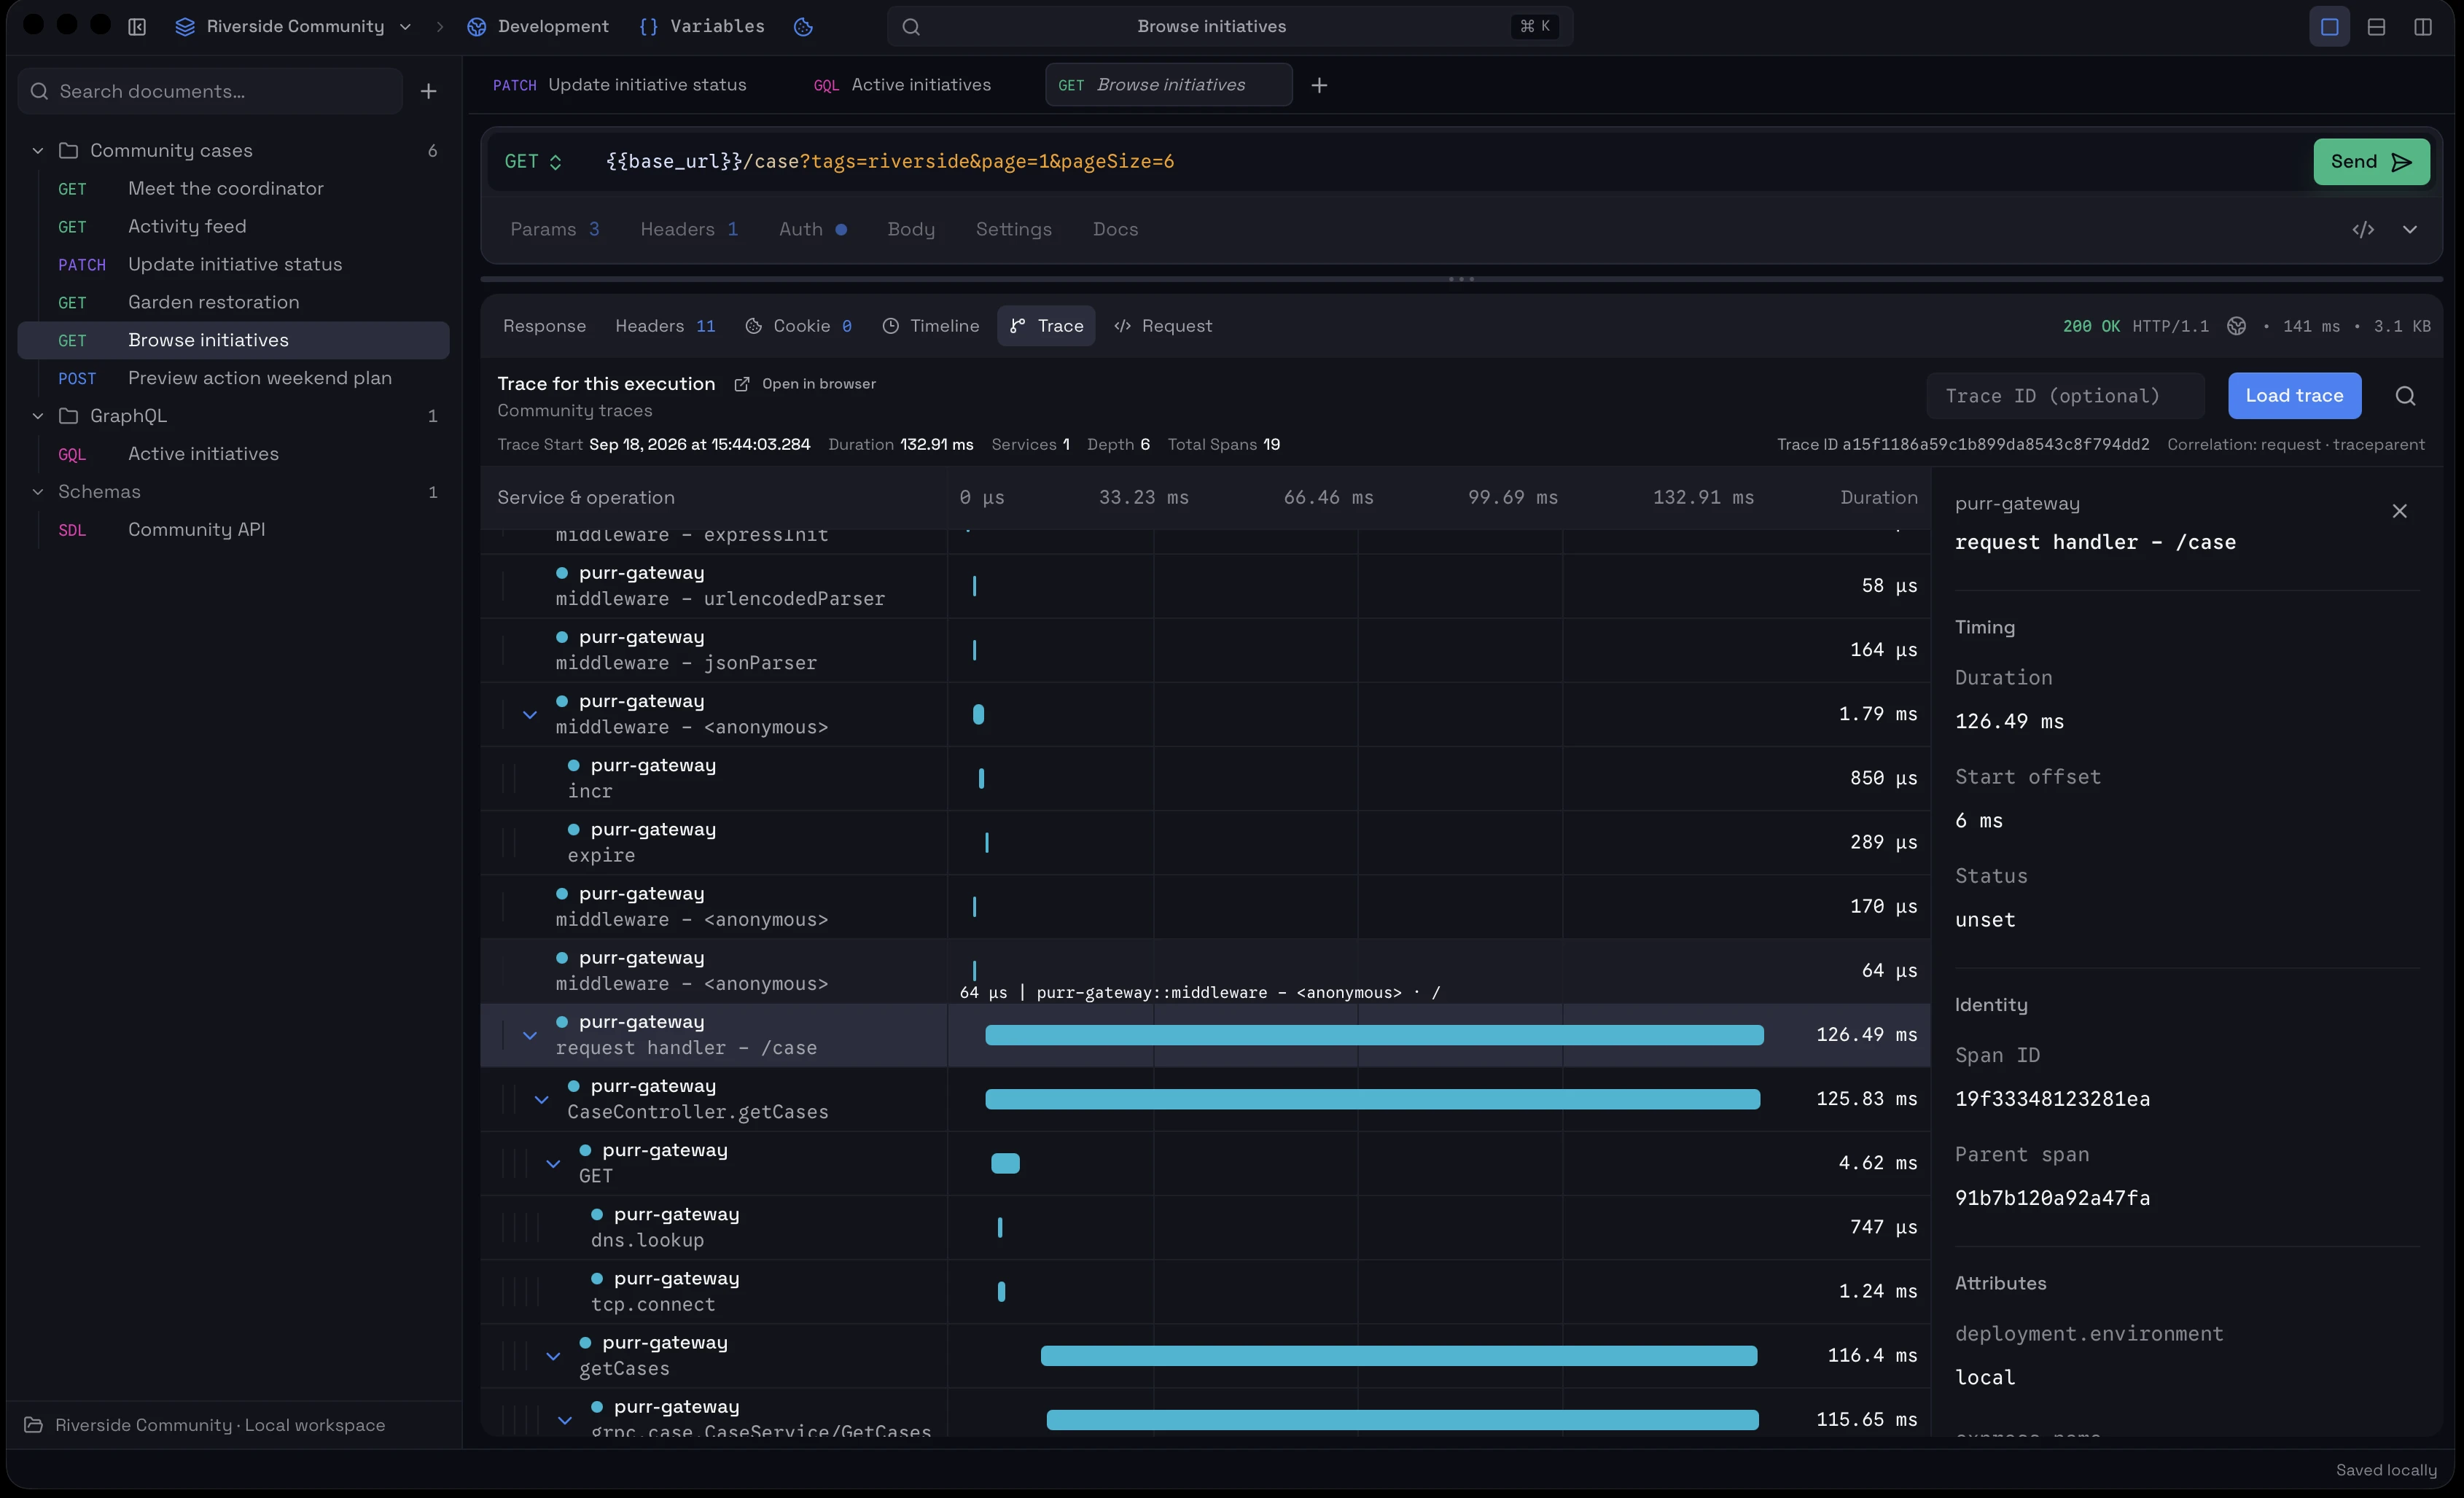
Send the request, enable tracing, and Purr correlates the response with the matching trace so you can open it directly from the request you just ran.
- Send request
- Receive response
- Correlate trace
- Inspect spans
WHY I ADDED THIS
Debugging shouldn’t start with searching for the request you just sent.
When I was debugging slower endpoints, sending the request was usually the easy part. The annoying part started after that.
I would send a request with curl, get the response, then open Jaeger and try to find the trace that belonged to that exact request. If the endpoint touched several services or did some CPU-heavy work, I would repeat this over and over while trying to understand where the time actually went.
A slow response tells you that something took too long. It rarely tells you what.
- Was it the database?
- Was it another service?
- Was it CPU work inside the application?
- Did one downstream request dominate the whole response time?
- Did my fix actually improve the part I thought it did?
The information already existed in tracing. The frustrating part was jumping from the API client to another tool and then searching for the trace manually. That felt like something the client could do for me.
REQUEST AND TRACE STAY TOGETHER
One request,
one debugging context.
Tracing in Purr is attached to the request workflow.
You send a request as usual. If tracing is enabled for it, Purr looks for the trace context associated with that execution and makes the matching trace available directly from the response.
You don’t need to copy IDs between tools or remember which request happened at which timestamp.
SEE WHERE THE TIME WENT
The response time
is only the beginning.
Once the trace is loaded, inspect the service tree and span durations to understand how the request moved through the system.
ILLUSTRATIVE TIMING EXAMPLE
824 ms tells only part of the story.
That is much more useful than knowing only that the endpoint was “slow”.
- API gateway
824 ms - Request handler
790 ms - Orders service
650 ms - Inventory request
520 ms - Database query
470 ms
USEFUL WHILE FIXING
I wanted this for the request I am actively testing.
- Change the code
- Send the request
- Inspect the trace
- Compare the result
Monitoring tools are great when an alert fires in production. But a lot of debugging happens before that.
You change the code, send the same request again, compare the behavior, and check whether the bottleneck moved or disappeared.
That loop is where having the trace directly beside the request becomes useful. Purr is meant to make that loop shorter.
CURRENT SUPPORT
Jaeger today.
More providers later.
The current tracing integration works with Jaeger. Configure your Jaeger connection, enable tracing for a request, and Purr handles the request-to-trace workflow from there.
The integration layer is being designed so other tracing and observability providers can be added later without changing how the request workflow works.
Set up Jaeger →KEEP IT OPTIONAL
No tracing
setup required.
Tracing is not required to use Purr. If all you need is an HTTP or GraphQL client, nothing changes.
Tracing only becomes part of the workflow when you configure it and enable it for the requests where it is useful.
Send the request.
Then see what actually happened.
Purr keeps the response and the trace connected so debugging does not start with searching through another tool.